Skip to main content
Teaching visuals
Make a relationship easier to explain. Start with what pupils should notice. Use the visual to connect a pattern, a representation and a reason.
Connect the equation to the graph. A value table, plotted points and a quadratic curve describe the same function. Ask pupils what each form makes easier to see.
Open the graph investigation Prepare a visual-teaching request Help me plan a visual explanation using the quadratic y = x² − 2x − 3. Ask for the class level and learning goal. Connect the value table, plotted points and graph features. Keep the visual a representation of a continuous function, then use another quadratic for independent explanation.
Copy request Review and copy the request into PLAI™ with the material you want to use.
A visual explanation of the worked Library task, with the supplied pupil worksheet to use alongside it.
y = x² − 2x − 3
x = −1y = 0 x = 1y = −4 x = 3y = 0
Connect the equation, table and graph.
Compare the same whole in two ways.
Two quarters Three sixths Four eighths
Do they show the same amount? What makes you say that?
Open the fractions worksheet Play the comparison sequence Primary Maths alternative
Keep the whole visible as the parts change. Compare one half with quarters, sixths and eighths. Ask pupils to explain why different partitions can represent the same amount.
Use the supplied bars, circles and number line on paper to continue the comparison.
Open the fraction representations Decide what the visual must make clear. Keep the model accurate. Confirm the scale, equal wholes or mathematical features being shown.
Give pupils a question. Ask for a prediction, comparison or explanation.
Use another case. Check whether pupils can explain a fresh relationship without the animation.
Make the thinking visible. Explore cards, diagrams, displays and visual models. Look for a representation that helps pupils notice a pattern, connect ideas or explain their thinking.
Take a closer look ↗ The teaching purpose Algorithm flowchart and pseudocode canvas Use the flowchart structure to trace decisions before writing pseudocode. Open the preview ↗ Computing · Planning template
Take a closer look ↗ The teaching purpose Artist study: The Great Wave Study the simplified wave illustration before pupils make their own visual response. Open the preview ↗ Art and design · Worksheet
Take a closer look ↗ The teaching purpose Assignment revision prompt cards Review a draft in order by checking its purpose and ideas, its format and then its spelling and punctuation. Open the preview ↗ Languages and literacy · Cards/display
Take a closer look ↗ The teaching purpose Bar models: books for the class library Compare the library-book bar models before completing the calculations. Open the preview ↗ Take a closer look ↗ The teaching purpose Bar-model problem solver Use a bar model to connect the quantities in a problem. Open the preview ↗ Take a closer look ↗ The teaching purpose Basketball referee cue cards Pupils should describe a situation, identify the relevant agreed rule, demonstrate or explain a signal and state how play restarts. They should communicate respectfully and recognise when a rule condition or uncertainty requires checking with the teacher or partner. Open the preview ↗ PE and health · Cards/display
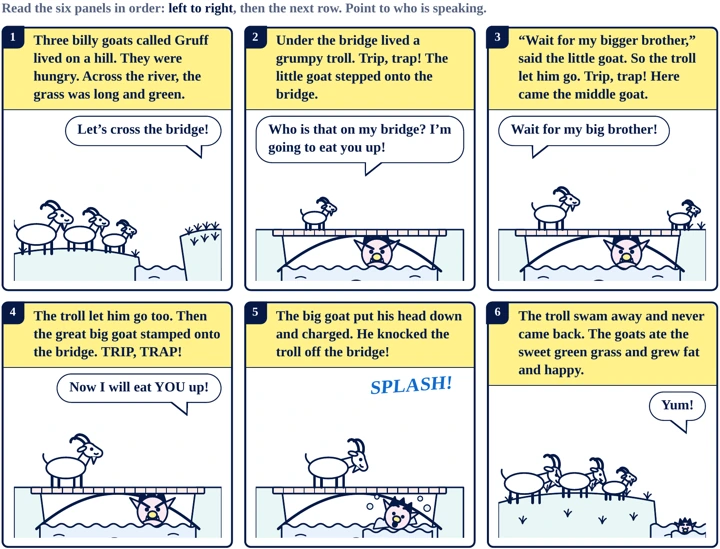
Take a closer look ↗ The teaching purpose Billy Goats Gruff: story mapping and retelling Use the story map to connect the events before retelling them. Open the preview ↗ Languages and literacy · Worksheet
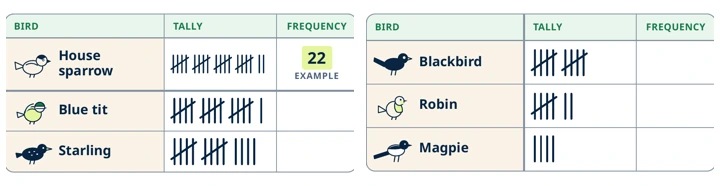
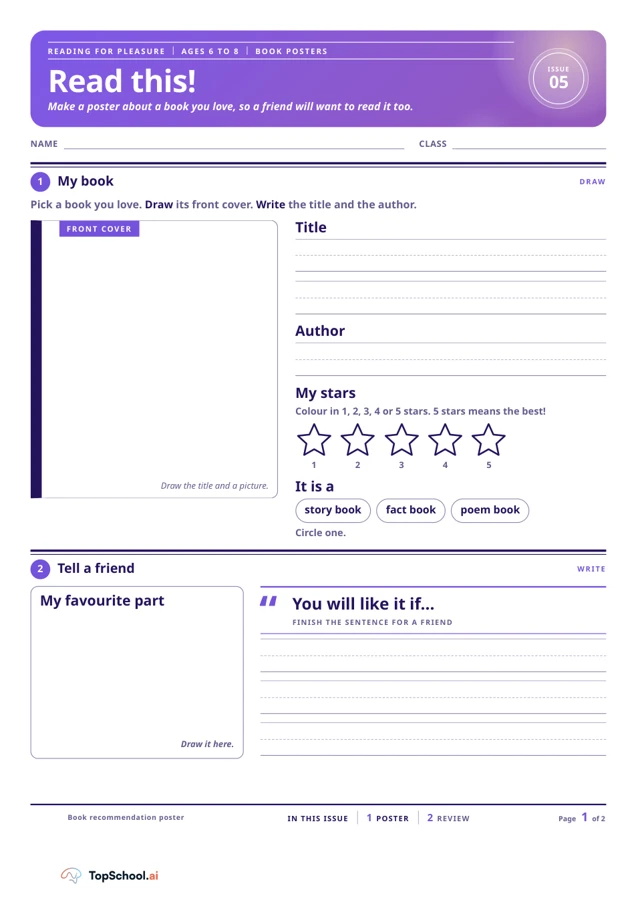
Take a closer look ↗ The teaching purpose Birds at our bird feeder: collect and graph data Connect the bird observations, recorded counts and graph. Open the preview ↗ Take a closer look ↗ The teaching purpose Book recommendation poster Create a book recommendation that gives identifying details, a personal response and a reason a friend might enjoy the book. Open the preview ↗ Languages and literacy · Cards/display
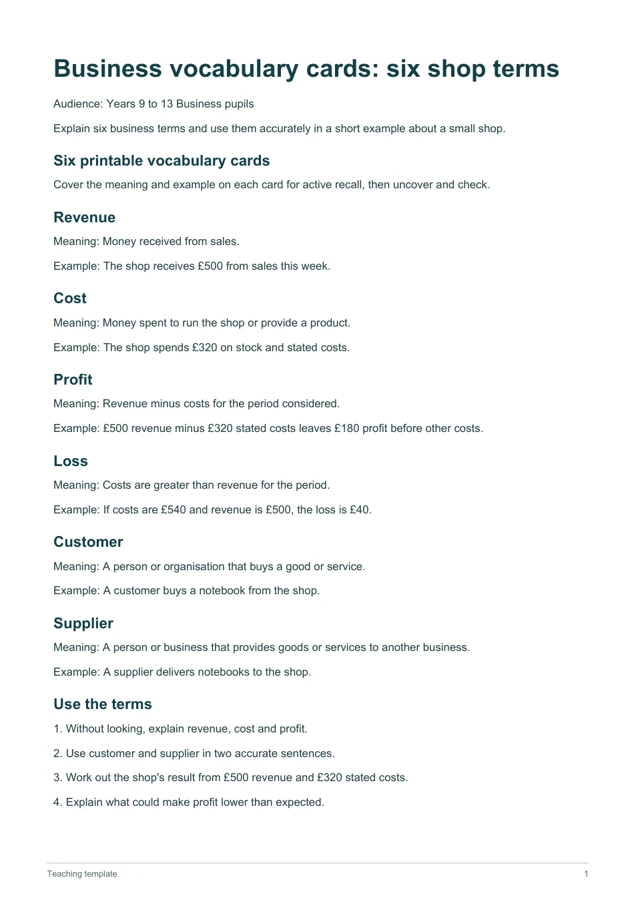
Take a closer look ↗ The teaching purpose Business vocabulary cards: six shop terms Explain six business terms and use them accurately in a short example about a small shop. Open the preview ↗ Business and economics · Cards/display
Take a closer look ↗ The teaching purpose Circuit lab: series and parallel Compare how a break in one bulb’s path affects a series circuit and a parallel circuit, using the model diagram and readouts to support an explanation. Open the preview ↗ Science · Interactive activity
Take a closer look ↗ The teaching purpose Classroom English: talk and learning cards Recognise six classroom participation words and use one in a short spoken sentence. Open the preview ↗ Languages and literacy · Cards/display
Take a closer look ↗ The teaching purpose Classroom expectations and values display Agree and communicate classroom routines through shared values, respectful conversation prompts and a class agreement. Open the preview ↗ Wellbeing and personal development · Cards/display
Take a closer look ↗ The teaching purpose Coastal landforms: label, explain and decide Use the coastal-landform diagrams to connect a feature with its explanation. Open the preview ↗ Take a closer look ↗ The teaching purpose Debate a school rain-garden location Use fictional school site notes and stated constraints to compare two rain-garden locations and justify a group decision. Open the preview ↗ Geography · Cards/display
Take a closer look ↗ The teaching purpose Design a science fair poster Generate and evaluate layout thumbnails, select a focal point and plan a readable, balanced science-fair poster. Open the preview ↗ Art and design · Cards/display
Take a closer look ↗ The teaching purpose Devising deck: stimulus cards and constraints Create a devised scene from a stimulus and constraint with a clear idea, opening, turning point and ending. Open the preview ↗ Music and performing arts · Cards/display
Take a closer look ↗ The teaching purpose English talk cards for learning together Use a clear English phrase to enter a conversation, ask for clarification and respond to a partner’s idea. Open the preview ↗ Languages and literacy · Cards/display
Take a closer look ↗ The teaching purpose Fraction wall: equivalent fractions Represent fractions on a shared whole, recognise equivalent amounts by comparing lengths and explain a fraction comparison. Open the preview ↗ Maths · Interactive activity
Take a closer look ↗ The teaching purpose Fractions three ways: show, compare and share Compare the same fraction in a bar, circle and number line. Open the preview ↗ Take a closer look ↗ The teaching purpose French sound chart: spelling and pronunciation Use the French sound chart to connect spelling and pronunciation. Open the preview ↗ Languages and literacy · Worksheet
Take a closer look ↗ The teaching purpose French talk cards: ask, answer and swap Ask and answer familiar French questions in a full phrase, take turns and use a clarification request when needed. Open the preview ↗ Languages and literacy · Cards/display
Take a closer look ↗ The teaching purpose Frog or toad? Comparing amphibians Use the frog-and-toad comparison to discuss visible similarities and differences. Open the preview ↗ Take a closer look ↗ The teaching purpose Goldilocks cards Put six story pictures in order and retell the sequence using first, then and last. Open the preview ↗ Languages and literacy · Cards/display
Take a closer look ↗ The teaching purpose Group roles: cards and rotation tracker Take responsibility for a group role, contribute to a shared task and rotate responsibilities over time. Open the preview ↗ Take a closer look ↗ The teaching purpose Help and feelings: multilingual prompt cards Recognise and use a short phrase to ask for help, communicate a need or describe a feeling. Open the preview ↗ Languages and literacy · Cards/display
Take a closer look ↗ The teaching purpose Instrument cards: meet the orchestra families Pupils should name the pictured instruments, sort them into strings, woodwind, brass and percussion, and explain the sound-making basis of a placement. They should use card details to distinguish a flute’s construction material from its family. Open the preview ↗ Music and performing arts · Cards/display
Take a closer look ↗ The teaching purpose Investigate a quadratic: graph and features Connect the quadratic value table with the graph and its features. Open the preview ↗ Take a closer look ↗ The teaching purpose Keep safe and follow a routine: picture cards Recognise a simple safety message or predict the next step in a familiar routine. Open the preview ↗ Wellbeing and personal development · Cards/display
Take a closer look ↗ The teaching purpose Les matières scolaires: French vocabulary cards Recognise eight French school-subject words with their articles and use one in a French opinion sentence. Open the preview ↗ Languages and literacy · Cards/display
Take a closer look ↗ The teaching purpose Nature vocabulary: six English picture cards Recognise and explain selected nature words by connecting each word with its picture, definition and example sentence. Open the preview ↗ Languages and literacy · Cards/display
Take a closer look ↗ The teaching purpose Number-line practice Use the number lines to show position, order and distance. Open the preview ↗ Take a closer look ↗ The teaching purpose Oral language and conversation cards Ask and answer familiar questions in Spanish using a full sentence, then combine two answers into one longer spoken or written sentence. Open the preview ↗ Languages and literacy · Cards/display
Take a closer look ↗ The teaching purpose Orbit lab: launch and compare Investigate how changing one starting condition affects a simulated planetary path, and use the readout to describe the resulting orbit. Open the preview ↗ Science · Interactive activity
Take a closer look ↗ The teaching purpose Our class jobs: rotating responsibilities Use the pictured class jobs to explain a routine and rotate responsibilities. Open the preview ↗ Teaching and classroom support · Worksheet
Take a closer look ↗ The teaching purpose Our Year 8 agreement: respect in practice Translate shared values into observable actions and agree one class routine to practise. Open the preview ↗ Wellbeing and personal development · Cards/display
Take a closer look ↗ The teaching purpose Parabola explorer: quadratic and sine graphs Pupils should predict a graph change, vary one coefficient and explain the result using both the equation and a feature. They should recognise linear or constant cases when the quadratic coefficient is zero and check rounded readouts against exact working where appropriate. Open the preview ↗ Maths · Interactive activity
Take a closer look ↗ The teaching purpose PE station and fitness circuit cards Follow a station card to practise a movement, use its teaching points and select an appropriate variation while following the stated safety directions. Open the preview ↗ PE and health · Cards/display
Take a closer look ↗ The teaching purpose Peer Appreciation and Community Cards Write a short appreciation message that names a specific action and explains why it mattered to the writer or community. Open the preview ↗ Wellbeing and personal development · Cards/display
Take a closer look ↗ The teaching purpose Phonics sound cards Say the initial sound for each pictured item and connect that sound with the supplied example words, using clear oral practice with familiar names. Open the preview ↗ Languages and literacy · Cards/display
Take a closer look ↗ The teaching purpose Photosynthesis lab Pupils should predict and explain how changing one input affects this model’s index, including a tie between lowest inputs. They should identify a limiting input without assuming that raising only one of several tied inputs will increase output. Open the preview ↗ Science · Interactive activity
Take a closer look ↗ The teaching purpose Place value and column calculation Use the place-value structure to explain a column calculation. Open the preview ↗ Take a closer look ↗ The teaching purpose Reading vocabulary and strategy bookmark Choose a useful reading strategy, use a prompt to apply it and record vocabulary with a meaning or example for later reading. Open the preview ↗ Languages and literacy · Cards/display
Take a closer look ↗ The teaching purpose Reasoning prompt cards Explain a mathematical claim using an example, representation or calculation, then listen to a partner’s reasoning, compare approaches and explain why. Open the preview ↗ Take a closer look ↗ The teaching purpose Science practical: think, use, report Follow approved practical instructions, use materials only as directed and explain how to report a problem. Open the preview ↗ Take a closer look ↗ The teaching purpose Sentence-starter speaking cards Use a starter phrase to express an observation, preference, feeling, idea, question or request during a supported conversation and listen to a partner. Open the preview ↗ Languages and literacy · Cards/display
Take a closer look ↗ The teaching purpose Shapes and textures mat Compare the shapes and textures before pupils choose or describe a match. Open the preview ↗ Take a closer look ↗ The teaching purpose Song show Join a song with a picture, repeated words or a simple movement, and notice when the song begins and ends. Open the preview ↗ Music and performing arts · Cards/display
Take a closer look ↗ The teaching purpose States of matter: a particle model Pupils should describe how water particles become more separated during boiling while remaining water molecules. They should distinguish temperature change from a phase-change plateau and explain that energy transfer changes intermolecular attractions while temperature and average kinetic energy remain constant on the plateau. Open the preview ↗ Science · Interactive activity
Take a closer look ↗ The teaching purpose Story prompt cards: look, talk, imagine Describe an illustrated scene, practise new vocabulary and invent a spoken story about what may happen next. Open the preview ↗ Communication and language · Cards/display
Take a closer look ↗ The teaching purpose Supply and demand: economic diagram analysis Use the economic diagrams to connect changes in supply or demand with the graph. Open the preview ↗ Business and economics · Worksheet
Take a closer look ↗ The teaching purpose Talk it through: discussion and debate cards Contribute to a discussion by giving reasons and examples, challenging ideas respectfully and explaining whether or why a view changed. Open the preview ↗ Languages and literacy · Cards/display
Take a closer look ↗ The teaching purpose Tamil letter match and picture cards Recognise six Tamil letters, match them to pictured words and locate repeated letters. Open the preview ↗ Languages and literacy · Cards/display
Take a closer look ↗ The teaching purpose The colour wheel: mixing and relationships Show relationships between colours before pupils mix and compare them. Open the preview ↗ Art and design · Worksheet
Take a closer look ↗ The teaching purpose The Space Race: timeline and significance Use the Space Race timeline to discuss sequence and historical significance. Open the preview ↗ History and social studies · Worksheet
Take a closer look ↗ The teaching purpose The water cycle in English, Spanish and your language Use the water-cycle sequence to connect the process with its vocabulary. Open the preview ↗ Take a closer look ↗ The teaching purpose Trusted adults and support cards Support a child to name trusted adults and understand a clear, setting-specific route for seeking help when something worries them. Open the preview ↗ Wellbeing and personal development · Cards/display
Take a closer look ↗ The teaching purpose Water cycle: an interactive model Pupils should explain a route through evaporation, condensation, precipitation and collection, then use the mountain example to connect cooling with droplet formation. They should recognise that condensation alone does not guarantee rain and identify a process or store omitted from the model. Open the preview ↗ Geography · Interactive activity
Take a closer look ↗ The teaching purpose What comes next? Early-years number and pattern Use the pictured number and pattern tasks to make a matching choice visible. Open the preview ↗ Take a closer look ↗ The teaching purpose What happens next? eight still-frame prompt cards Use one visual still prompt to infer setting and mood, then draft two possible continuations without treating the prompt as a finished story. Open the preview ↗ Languages and literacy · Cards/display
Take a closer look ↗ The teaching purpose Words that grow: Frayer model for photosynthesis Read the four parts of the worked Frayer model together. Open the preview ↗ Browse all resources in the full Library .
Resource preview Close ×
Bring the idea you want pupils to see. Keep the question, visual and independent explanation connected.
Start with PLAI™ Your analytics choice May we use analytics cookies to understand which teaching resources are useful? Your choice does not affect access to the Library. You can change it below in Analytics choices.
Read our cookie policy No analytics Allow analytics