
Maths
Investigate a quadratic: graph and features
Build a value table for a quadratic, plot a smooth curve and read its roots, intercept, turning point, symmetry, range and domain. A worked example links standard, factorised and completed-square forms before pupils investigate a second function.
Follow the worked quadratic from its plotted points to its roots, intercept and turning point.
Read the complete materialRead the material
Build a value table for a quadratic, plot a smooth curve and read its roots, intercept, turning point, symmetry, range and domain. A worked example links standard, factorised and completed-square forms before pupils investigate a second function.
Activity. Use the preview for diagrams and layout.
Page 1
NAME
CLASS
DATE
LEARNING GOAL
I can draw the graph of a quadratic function
and use it to describe the function's key
features.
SUCCESS CRITERIA
I can square negatives correctly in a table of values.
I can plot points and join them with one smooth curve.
I can read roots, intercepts, turning point and range.
I can link algebraic forms to features of the graph.
1
Worked example: build the table for y = x2 − 2x − 3
Work out each row, then add down the column to get y. A negative squared is always positive.
x
−2
−1
0
1
2
3
4
x2
4
1
0
1
4
9
16
−2x
4
2
0
−2
−4
−6
−8
−3
−3
−3
−3
−3
−3
−3
−3
y
5
0
−3
−4
−3
0
5
2
Plot the points, then read the features
A
A
B
C
D
x
y
−2
−2 −1
−1
1
2
3
4
−4
−4
−3
−3
−2
−2
−1
−1
1
2
3
4
5
0
1 square = 1 unit on both axes. Plot each
point as a small cross, then draw one
smooth curve through them all: rounded at
the bottom, never pointed or flat.
A
ROOTS
x = −1 and x = 3
The curve meets the x-axis.
B
Y-INTERCEPT
(0, −3)
At x = 0, y is the constant.
C
TURNING POINT
(1, −4), minimum
The lowest point of the curve.
D
LINE OF SYMMETRY
x = 1
x = −2 and x = 4 both give 5.
R
RANGE
y ≥ −4
Nothing lies below it.
E
DOMAIN, ASYMPTOTES
All real x; none
It never levels off.
ONE FUNCTION, THREE FORMS
x2 − 2x − 3 = (x + 1)(x − 3) = (x − 1)2 − 4
Factorised shows the roots: a bracket is
0 when x = −1 or x = 3.
Completed square shows the turning
point: (x − 1)2 is smallest, 0, at x = 1.
Function graph investigation · Worked example
MATHEMATICS
AGES 14 TO 16
QUADRATIC GRAPHS
Function graph investigation
Plot a quadratic, then read its story from the graph.
Page 1 of 2
Page 2
1
Complete the table of values
Fill each row, then add down the columns, as on page 1.
4 marks
x
−5
−4
−3
−2
−1
0
1
2
3
x2
+2x
−8
−8
−8
−8
−8
−8
−8
−8
−8
−8
y
2
Draw the graph
Plot, join, label A to D.
3 marks
x
y
−5
−5 −4
−4 −3
−3 −2
−2 −1
−1
1
2
3
−9
−9
−8
−8
−7
−7
−6
−6
−5
−5
−4
−4
−3
−3
−2
−2
−1
−1
1
2
3
4
5
6
7
3
Read the features
7 marks
A
ROOTS
x =
 and x =
B
Y-INTERCEPT
( 0 ,
 )
C
TURNING
POINT
(
 ,
 )
minimum
maximum
D
LINE OF
SYMMETRY
x =
  Check: (
 +
 ) ÷ 2 =
R
RANGE
E
DOMAIN,
ASYMPTOTES
Domain:
  Asymptotes?
yes
no
Explain: why is the y-intercept always the constant term of a quadratic?
4
Connect the forms
4 marks
x2 + 2x − 8 = (x +
)(x −
)
This form shows the
x2 + 2x − 8 = (x +
)2 −
This form shows the
Check by expanding: do you get x2 + 2x − 8 back?
GO FURTHER
What changes for y = −x2 + 4? Plot it on your grid
for −3 ≤ x ≤ 3 with a dashed curve. Name two
features that change and one that stays the same.
Function graph investigation · Total 18 marks
FUNCTION GRAPH INVESTIGATION
YOUR TURN
Investigate y = x2 + 2x − 8
Page 2 of 2
A teaching sequence
Calculate and graph a quadratic function and connect its algebraic forms to key graph features.
Follow the worked quadratic from its plotted points to its roots, intercept and turning point.
Read the complete materialBuild and plot the table
Calculate each table value for y = x² − 2x − 3, remembering that a negative value squared is positive. Plot the coordinates and draw a smooth curve.
For a negative x, have you squared the whole value before subtracting 2x?
Follow the worked quadratic from its plotted points to its roots, intercept and turning point.
Read the complete materialConnect graph and forms
Read the roots, y-intercept, turning point and line of symmetry. Compare standard, factorised and completed-square forms to check the features.
Where do the factorised and completed-square forms show the roots and turning point?
Investigate the second curve
Complete and plot y = x² + 2x − 8, using its factorised and completed-square forms to check your answers.
Does expanding your factorised form recover x² + 2x − 8?
Compare an inverted curve
Try y = −x² + 4 on the same grid and describe two changed features and one that stays. Use completed-square form to identify the turning point and verify that point on the graph.
Which feature changes for y = −x² + 4, and which remains?
Before you teach
Look for the thinking behind an answer, choose the support your class needs and leave room for an independent response.
What to look for
Check table values, coordinate placement, curve shape and labels. Roots occur where the graph crosses the x-axis; the y-intercept occurs at x = 0. Confirm that the line of symmetry passes through the turning point and that the stated range reflects the minimum or maximum.
Give a little support
Use graph paper or a digital plotting tool to practise coordinates before completing the worksheet. Separate the calculations for x², the linear term and the constant in different colours. Provide a table of square numbers if needed, then return to the complete equation.
Take the idea further
Ask pupils to create a quadratic with a chosen turning point or pair of roots, then write it in two forms and sketch the graph. They can compare how a negative leading coefficient changes the shape and range.
Things to keep in mind
The grids show a finite set of values and the graph is a representation of a continuous function. Read domain and range from the function, not only the visible grid. The prompts cover quadratic examples and do not replace broader function notation or proof.
Keep the idea. Make it yours.
Bring your topic, learning goal and class context to PLAI™, then review what you create.
Another starting point
Explore a different teaching task from this selection.
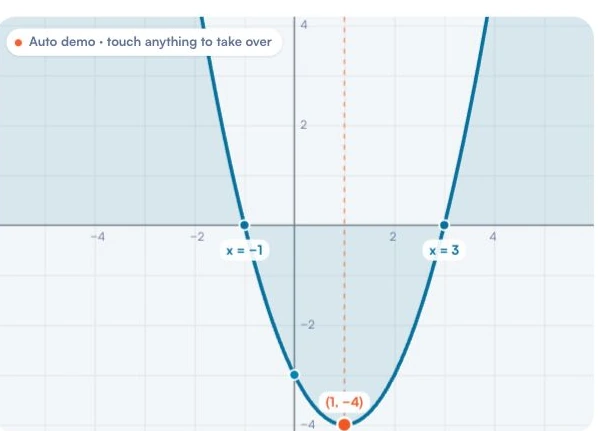
Parabola explorer: quadratic and sine graphs
Take control with a slider and read its coefficient value and the displayed equation. Keep the other two coefficients fixed before making the first prediction.
Explore resourceIdeas to try with your class
Sample teaching perspectives on what to try, what to adapt and what to watch for.
Meet The Creators
Meet the creators whose teaching interests connect with this template. Find an approach to try with your class.

Lukas Brandt
I plan Mathematics for pupils bringing different curricular methods, using small steps and whiteboard time to make notation and working explicit before speed becomes a priority.
Meet the creator
Wei Ling Chua
I begin Mathematics with worked examples and deliberate practice, checking understanding before removing prompts so pupils can carry a method through and explain why it applies.
Meet the creator
Priyanka Deshmukh
I value prompts that ask pupils to explain what a symbol represents and why a step follows, so that notation carries the reasoning rather than hiding it.
Meet the creator
Bright Margins
The worked quadratic table leads to roots, y-intercept, turning point, symmetry and range, then shows the same function in standard, factorised and completed-square forms. The “negative squared is positive” note targets a key calculation step.
Chalk Dust & Checklists
For ages 14 to 16, the task connects values and graph shape to algebraic features: brackets show roots, while completed square shows the minimum. Pupils then use a second function to repeat the investigation.
Glue Stick Club
Plot each table pair as a cross and draw one smooth curve, as instructed. Reading one feature from its form before checking the graph can help pupils see why the three expressions describe the same quadratic.
Good Question
A plotted graph gives a visual check but should not replace algebraic reasoning or precise coordinates. Check negative substitutions and the stated domain/range interpretation before using the graph as evidence of a wider function understanding.