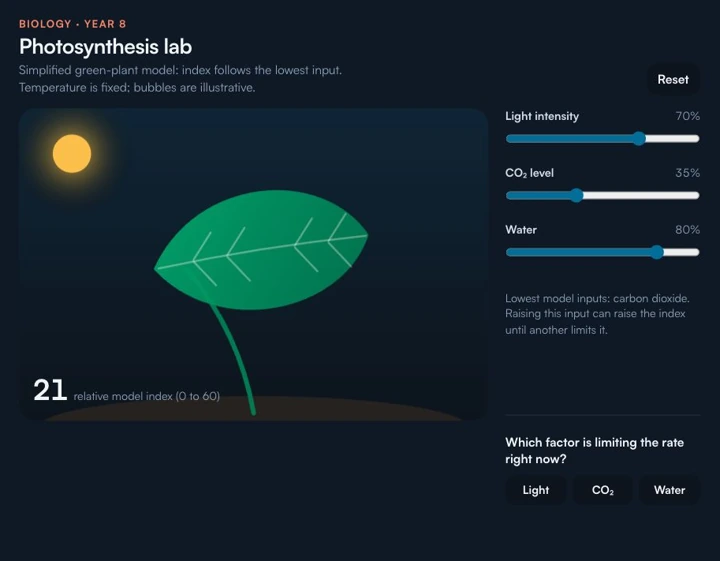
Pupils should predict and explain how changing one input affects this model’s index, including a tie between lowest inputs. They should identify a limiting input without assuming that raising only one of several tied inputs will increase output.
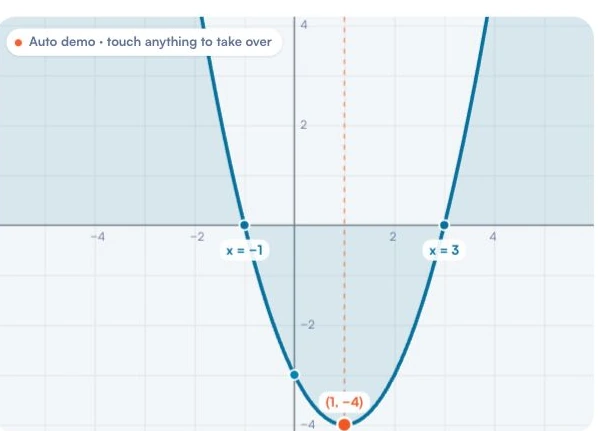
Pupils should predict a graph change, vary one coefficient and explain the result using both the equation and a feature. They should recognise linear or constant cases when the quadratic coefficient is zero and check rounded readouts against exact working where appropriate.
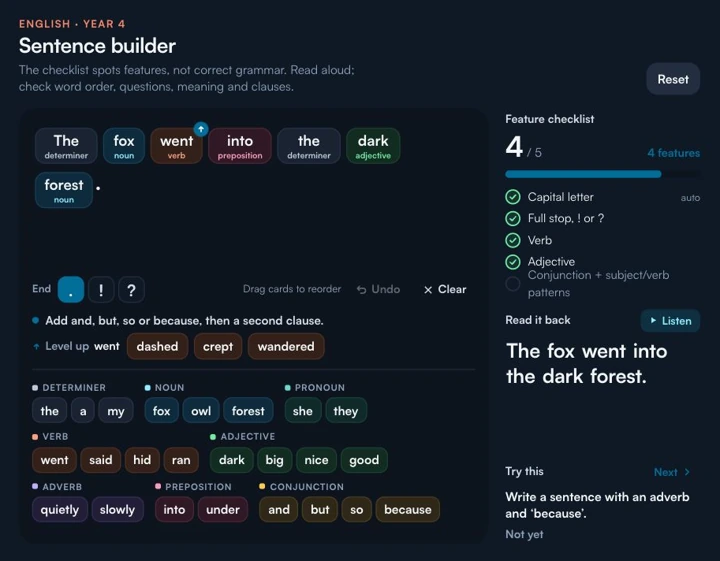
Pupils should arrange words into a meaningful sentence, review word order and punctuation, and explain a change that improves the intended meaning. They should identify a problem the feature checklist cannot reliably judge and revise it through reading and discussion.
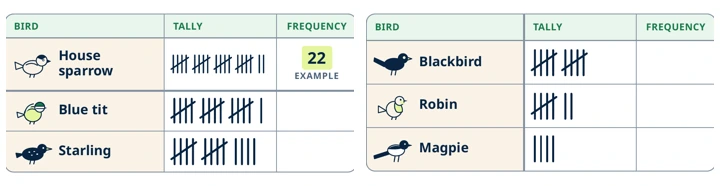
Pupils should convert all six tallies to frequencies, draw bars at two birds per square and answer comparison questions using the chart. They should also specify where, when and for how long a proposed survey would run.
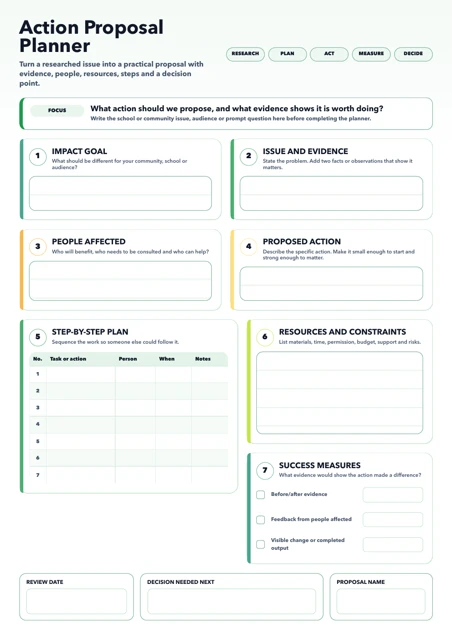
Produce a proposal that connects a defined issue and evidence with a specific action, named people or resources, and evidence to review before a next decision.
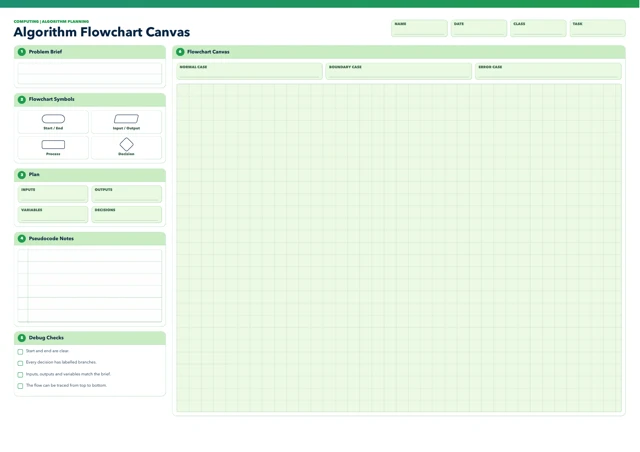
Represent a problem-solving algorithm using suitable flowchart symbols and pseudocode notes, then check its branches against normal, boundary and error cases.
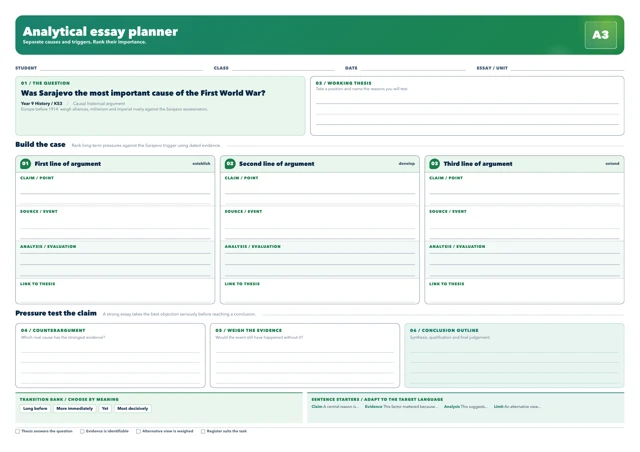
Develop a historical argument that answers the question, supports claims with identifiable evidence and weighs an alternative cause before reaching a judgement.
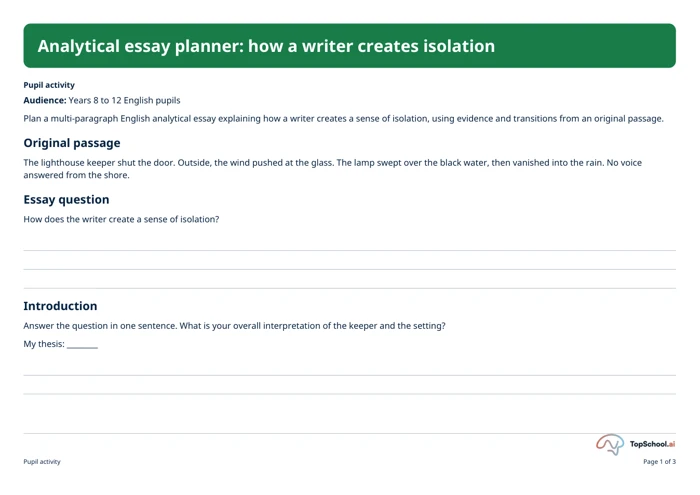
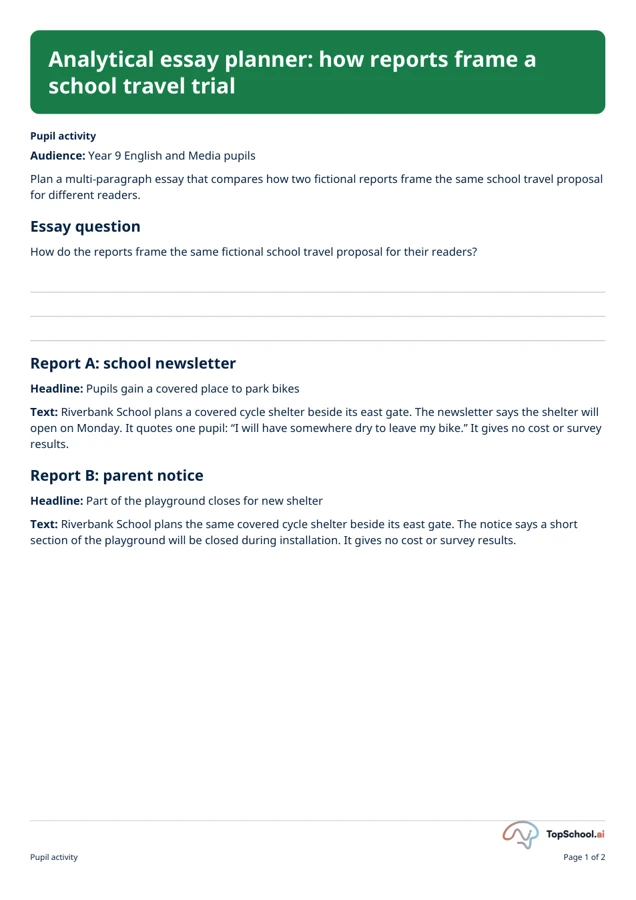
Plan a multi-paragraph English analytical essay explaining how a writer creates a sense of isolation, using evidence and transitions from an original passage.
No resources match this context. Clear the filters or choose another context.
The full catalogue could not be loaded. The first twelve items remain available. Reload to try again.
Your analytics choice
May we use analytics cookies to understand which teaching resources are useful? Your choice does not affect access to the Library. You can change it below in Analytics choices.