
Science
Pondweed and light: CER writing frame
Use a pondweed dataset to practise a scientific claim, evidence and reasoning paragraph, then judge and improve sample answers. Pupils can work with the supplied numbers while noticing an anomaly and avoiding a causal claim the activity does not establish.
The supplied investigation table and graph keep the distance and bubble-rate units, repeats and marked anomaly together.
Read the complete materialRead the material
Use a pondweed dataset to practise a scientific claim, evidence and reasoning paragraph, then judge and improve sample answers. Pupils can work with the supplied numbers while noticing an anomaly and avoiding a causal claim the activity does not establish.
Activity. Use the preview for diagrams and layout.
Page 1
NAME
CLASS
DATE
LEARNING GOAL
I can write a scientific argument using data
as evidence.
SUCCESS CRITERIA
I can make a claim backed by numbers.
I can explain the pattern with a science idea.
I can judge how strong the evidence is.
1
How does lamp distance affect the rate of photosynthesis in pondweed?
A lamp shone on pondweed from five distances. Oxygen bubbles were counted for one minute, three times each.
DISTANCE (CM)
REPEAT 1
REPEAT 2
REPEAT 3
MEAN
10
42
45
39
42
20
30
28
32
30
30
19
21
11
20*
40
13
12
14
13
50
8
9
7
8
11 anomaly. *Mean of 19 and 21 only. Values in bubbles per minute.
0
10
20
30
40
50
0
10
20
30
40
50
Distance from lamp (cm)
Bubbles per minute
anomaly (11)
2
MODEL
Which wrap keeps hot water warm longest: foil, wool or nothing?
C
Claim. Wool keeps hot water
warm for longest.
E
Evidence. Mean drop in 20
minutes: wool 12 °C, foil 18 °C,
unwrapped 25 °C.
R
Reasoning. Wool traps air, a
poor conductor, so less thermal
energy is transferred.
3
Now write your own CER
6 marks
Carry on writing after each starter. Quote two or more means, with units, and use the useful words.
C
Claim: As the lamp moves further away, the rate of photosynthesis
E
Evidence: At 10 cm the mean was ___ bubbles per minute, but
R
Reasoning: This happens because plants use light energy to
STRENGTH OF EVIDENCE
Enough repeats?
Yes
No
Anomaly left out?
Yes
No
Fair test?
Yes
No
Same pattern every time?
Yes
No
My evidence is (circle):
weak
fair
strong
USEFUL WORDS
photosynthesis
light energy
oxygen
rate
intensity
Scientific CER writing frame · Data from a class investigation
SCIENCE
AGES 11 TO 14
PHOTOSYNTHESIS
Pondweed and light
Argue like a scientist: Claim, Evidence, Reasoning.
Page 1 of 2
Page 2
4
Judge each answer, then fix it
6 marks
Tick the parts each answer really has, circle its biggest problem, then rewrite the weakest part.
ANSWER A
Has:
C
E
R
"The closer the lamp, the more bubbles there
were, because plants like light."
BIGGEST PROBLEM: CIRCLE ONE
no claim
no numbers
no science idea
overclaims
MY REWRITE
ANSWER B
Has:
C
E
R
"At 10 cm there were 42 bubbles per minute
and at 50 cm there were 8. At 30 cm one result
was 11."
BIGGEST PROBLEM: CIRCLE ONE
no claim
no numbers
no science idea
overclaims
MY REWRITE
ANSWER C
Has:
C
E
R
"As the lamp moves further away,
photosynthesis slows down. This proves that the
distance causes photosynthesis."
BIGGEST PROBLEM: CIRCLE ONE
no claim
no numbers
no science idea
overclaims
MY REWRITE
GO FURTHER
The lamp also gives out heat. How could this make the 10 cm result unfair, and how would you control it?
5
Peer feedback
Swap sheets with a partner
MISSING
PARTLY
THERE
STRONG
C
Claim answers the question
E
Two or more numbers, with
units
R
Science idea explains the link
Feedback from
After feedback, how confident are you writing a CER?
Not yet
Getting there
Got it
Scientific CER writing frame · Total 12 marks
PONDWEED AND LIGHT
JUDGE AND IMPROVE
Spot the weak CER
Three pupils used the same data. None of their answers is quite right.
ONE THING THAT WORKS
ONE THING TO IMPROVE
Page 2 of 2
A teaching sequence
Use two or more values with units to support a claim, connect a pattern to a science idea and judge how strong the evidence is.
The supplied investigation table and graph keep the distance and bubble-rate units, repeats and marked anomaly together.
Read the complete materialMake a bounded data claim
Write a claim about how lamp distance relates to the recorded bubble rate. Use “relates to” or “in this dataset” rather than claiming distance alone proves a cause.
Does the wording describe a relationship in this dataset rather than prove a cause?
The supplied investigation table and graph keep the distance and bubble-rate units, repeats and marked anomaly together.
Read the complete materialUse two means with units
Select at least two means and include bubbles per minute. Explain how the pattern connects to light energy and photosynthesis.
How do the selected bubble rates support the pattern you describe?
The supplied investigation table and graph keep the distance and bubble-rate units, repeats and marked anomaly together.
Read the complete materialEvaluate repeats and the anomaly
Use the strength-of-evidence prompts to consider repeats, the anomaly, fairness of the test and whether the pattern is consistent.
What changes when the eleven at thirty centimetres is excluded from the mean?
Revise and exchange a CER response
Identify each sample CER's parts and main weakness, then revise the weakest part using the data. Exchange feedback on claim, two values with units and science reasoning before choosing a confidence response.
Does the revision combine a claim, two values with units and a relevant science idea?
Before you teach
Look for the thinking behind an answer, choose the support your class needs and leave room for an independent response.
What to look for
Look for a claim that answers the question, numerical evidence with units and reasoning that explains the relationship. Check that pupils do not use the omitted 11 as though it contributed to the printed mean, and ask what a fair test would need to control.
Give a little support
Provide a partially completed CER sentence and a small table of the means. Let pupils highlight claim, evidence and reasoning in different colours, and allow oral rehearsal before they write. Explain “anomaly” as a result that differs from the others in this set.
Take the idea further
Ask pupils to identify how lamp heat could affect the test and propose a control. They can compare the interpretation when the anomaly is included with the stated mean, while keeping both versions transparent.
Things to keep in mind
The dataset is presented as coming from a class investigation, but its source and collection conditions are not documented in this file. The 11 at 30 cm is excluded from the printed mean. A pattern in these results does not by itself prove that distance caused the change.
Keep the idea. Make it yours.
Bring your topic, learning goal and class context to PLAI™, then review what you create.
Another starting point
Explore a different teaching task from this selection.
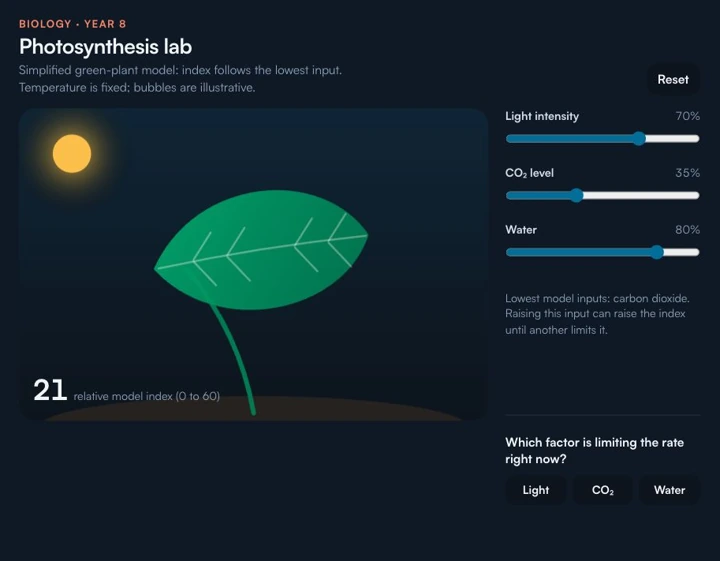
Photosynthesis lab
Select Reset and read the three starting levels. Identify the lowest input before changing a slider, then predict what increasing a different input will do.
Explore resourceIdeas to try with your class
Sample teaching perspectives on what to try, what to adapt and what to watch for.
Meet The Creators
Meet a creator whose teaching interests connect with this template.
Helpful Highlighter
This two-page CER frame asks how lamp distance affects pondweed photosynthesis, provides three bubble-count repeats at five distances and asks pupils to use at least two values with units, explain a pattern and judge evidence strength.
One Last Sticky Note
The repeated counts and means give a specific dataset for connecting a claim to evidence and a science idea. Asking how strong the evidence is invites pupils to consider variation rather than state a conclusion from one value.
Chalk & Chai
Read the units and compare repeat values before discussing the mean. Use a frame that separates claim, numerical evidence and reasoning, then ask what the data do not establish.
Planning List
The provided table is the evidence in this task; it does not establish results for a different lamp, plant or setup. Check the arithmetic and note that bubble counts are a proxy in this stated investigation.