
Geography
River fieldwork: record, calculate and explain
Collect observations and measurements at three river sites, then use the results to calculate cross-sectional area, velocity and discharge. A worked fictional example shows the calculation sequence, followed by prompts to compare downstream changes and assess the reliability of the method.
Read the material
Collect observations and measurements at three river sites, then use the results to calculate cross-sectional area, velocity and discharge. A worked fictional example shows the calculation sequence, followed by prompts to compare downstream changes and assess the reliability of the method.
Activity. Use the preview for diagrams and layout.
Page 1
SITE
NAME
LOCATION OR GRID REF
DATE
FROM SOURCE (KM)
WEATHER NOW
Dry
Showers
Heavy rain
RAIN IN THE LAST TWO DAYS?
Yes
No
TIME
metres, seconds
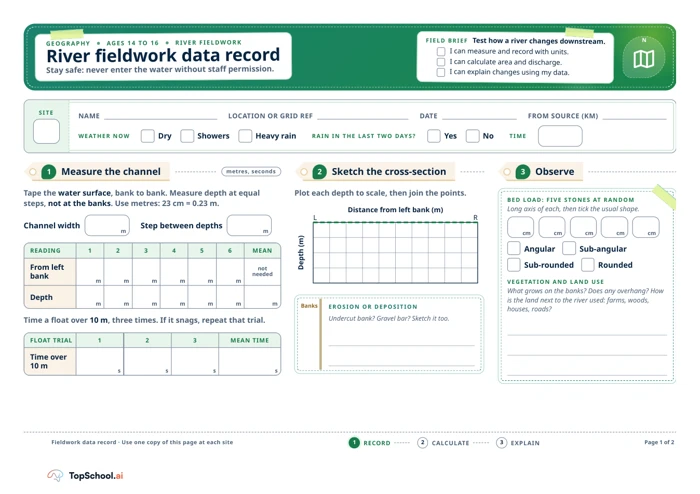
Tape the water surface, bank to bank. Measure depth at equal
steps, not at the banks. Use metres: 23 cm = 0.23 m.
Channel width
Step between depths
READING
1
2
3
4
5
6
MEAN
From left
bank
not
needed
Depth
Time a float over 10 m, three times. If it snags, repeat that trial.
FLOAT TRIAL
1
2
3
MEAN TIME
Time over
10 m
Plot each depth to scale, then join the points.
Distance from left bank (m)
L
R
Depth (m)
Fieldwork data record · Use one copy of this page at each site
1
RECORD
2
CALCULATE
3
EXPLAIN
GEOGRAPHY
AGES 14 TO 16
RIVER FIELDWORK
River fieldwork data record
Stay safe: never enter the water without staff permission.
FIELD BRIEF Test how a river changes downstream.
I can measure and record with units.
I can calculate area and discharge.
I can explain changes using my data.
N
1
Measure the channel
m
m
m
m
m
m
m
m
m
m
m
m
m
m
m
s
s
s
s
2
Sketch the cross-section
EROSION OR DEPOSITION
Undercut bank? Gravel bar? Sketch it too.
Banks
3
Observe
BED LOAD: FIVE STONES AT RANDOM
Long axis of each, then tick the usual shape.
Angular
Sub-angular
Sub-rounded
Rounded
cm
cm
cm
cm
cm
VEGETATION AND LAND USE
What grows on the banks? Does any overhang? How
is the land next to the river used: farms, woods,
houses, roads?
Page 1 of 2
Page 2
GO FURTHER
Width rises about 3 times from Site 1 to Site 3,
but discharge about 21 times. Why? Think:
width × depth × velocity.
10 marks
Work out Sites 1 and 3 with the same five steps.
Give area and discharge to 3 decimal places.
SITE
WIDTH
DEPTHS (M)
TIMES (S)
1
1.80 m
0.08, 0.14, 0.17,
0.12, 0.09
40.2, 38.6,
41.2
3
5.20 m
0.28, 0.46, 0.58,
0.50, 0.38
20.4, 19.6,
20.0
UPSTREAM TO
DOWNSTREAM
SITE 1
SITE 2
SITE 3
Width (m)
1.80
3.60
5.20
Mean depth (m)
0.30
Area (m²)
1.080
Mean time (s)
25.0
Velocity (m/s)
0.40
Discharge (m³/s)
0.432
10 marks
Fieldwork data record · Alder Brook and all readings are fictional
1
RECORD
2
CALCULATE
3
EXPLAIN
GEOGRAPHY
AGES 14 TO 16
CALCULATE AND ANALYSE
From readings to discharge
4
Worked example: Site 2
ALDER BROOK READINGS (FICTIONAL)
Width 3.60 m. Depths 0.18, 0.31, 0.42, 0.36, 0.23 m.
Times over 10 m 24.8, 25.6, 24.6 s.
Units: m × m = m², then m² × m/s = m³/s.
Mean depth = total ÷ number
1.50 ÷ 5 = 0.30 m
1
Area = width × mean depth
3.60 × 0.30 = 1.080 m²
2
Mean time = total ÷ 3
75.0 ÷ 3 = 25.0 s
3
Velocity = distance ÷ time
10 ÷ 25.0 = 0.40 m/s
4
Discharge = area × velocity
1.080 × 0.40 = 0.432 m³/s
5
5
Your turn
6
Analyse
Describe how width, depth and velocity
change downstream, using figures. Then
explain why.
Q1
4
marks
How reliable are the velocity results? Give a
reason from the method.
Q2
3
marks
Suggest two ways to improve the method.
Q3
3
marks
Page 2 of 2
A teaching sequence
Record river measurements with units, calculate area and discharge, and use the data to explain a downstream pattern.
Record the authorised site's channel
At each river site, measure bank-to-bank width and five equal-step depths, sketch the cross-section and note erosion, deposition, vegetation and land use. Do not enter the water without staff permission.
Have staff approved access, and are widths and depths recorded in metres?
Record bed load and repeated float trials
Select five bed-load stones at random, record long axes in centimetres and classify shape. Time a float over 10 metres three times; repeat a snagged trial.
Which trial must be repeated because the float snagged?
Calculate in the worked order
Calculate mean depth, area, velocity and discharge in order, with units. Use the worked fictional Site 2 example to check the method.
Do the units progress from metres to square metres and cubic metres per second?
Compare sites and evaluate the method
Compare width, depth and velocity downstream using figures, then judge reliability and suggest improvements. Compare readings before using the mean.
Which recorded figures support the pattern, and which limitation affects confidence?
Before you teach
Look for the thinking behind an answer, choose the support your class needs and leave room for an independent response.
What to look for
Look for measurements with units, readings taken at the stated positions, a visible calculation trail and consistent rounding. Check that pupils distinguish observation from explanation and refer to their own data. Ask how repeated timings or a snagged float affect confidence in the velocity estimate.
Give a little support
Model the measuring positions and the conversion from centimetres to metres before fieldwork. Use a calculator and a unit-conversion prompt card. Pupils may work in roles such as measurer, recorder and timer; check that each group understands how to repeat a snagged trial.
Take the idea further
Ask pupils to compare measurement uncertainty across sites and propose a repeatable sampling plan. They can explain why a large change in discharge may involve changes in depth and velocity as well as width, then identify another variable to measure.
Things to keep in mind
River conditions and access can change quickly. Complete the school’s site-specific risk assessment and follow staff instructions; pupils must not enter the water without permission. A float estimate and five depth readings simplify a complex, variable channel.
Keep the idea. Make it yours.
Bring your topic, learning goal and class context to PLAI™, then review what you create.
Ideas to try with your class
Sample teaching perspectives on what to try, what to adapt and what to watch for.
Meet The Creators
Meet a creator whose teaching interests connect with this template.
Helpful Highlighter
The river record has separate spaces for width, six depth readings, three float times, a cross-section, bed-load shape, land use, area and discharge. It includes unit guidance such as converting 23 cm to 0.23 m.
Bright Idea Break
The two-page task connects field measurements to a downstream explanation using width, depth and velocity. Its Site 1 to 3 comparison asks why discharge may rise more than width, returning pupils to the variables they measured.
Pocketful of Stories
The equal-step depth method and repeated float trials give pupils a consistent recording routine. A teacher can model one mean before pupils calculate the remaining values to three decimal places.
After the Bell
The sheet explicitly says never to enter water without staff permission. Site access, weather, supervision and risk approval need separate checks; the form does not make a river visit safe by itself.